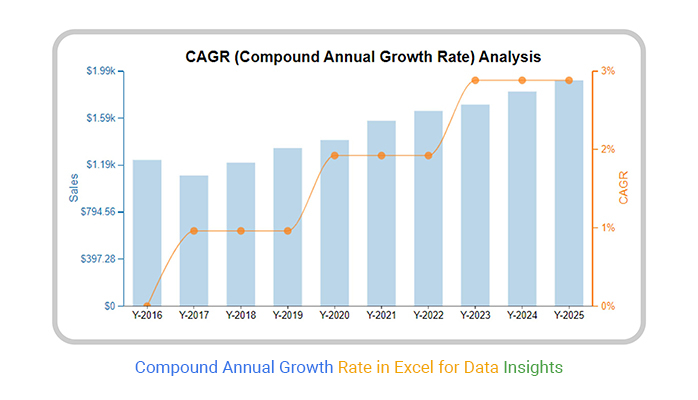
Compound Annual Growth Rate: Measuring Investment Performance
Table of Contents
- The Illusion of Average Returns
- What is Compound Annual Growth Rate (CAGR)?
- The Mechanics: How CAGR is Calculated
- CAGR vs. Arithmetic Mean: Why the Difference Matters
- The Impact of Volatility Drag and Variance Drain
- Practical Applications in Portfolio Analysis
- Limitations and Risks of Relying on CAGR
- CAGR Strategy: Benchmarking and Asset Comparison
- Frequently Asked Questions
- Final Analysis
The Illusion of Average Returns
Consider two hypothetical portfolios. Portfolio A gains 50% in its first year but suffers a 20% loss in the second. Portfolio B gains a steady 10% in year one and another 10% in year two. A superficial analysis of Portfolio A suggests a healthy average return of 15% per annum [(50 – 20) / 2]. However, the actual capital remaining in the account tells a different story. The compound annual growth rate (CAGR) reveals that the simple average is a mathematical mirage that ignores the sequence of returns and the erosion of principal.
For active traders and long-term investors, this distinction is the difference between a realistic retirement projection and a failed financial plan. When fund managers advertise an average annual return, they are often citing the arithmetic mean, which effectively masks the impact of deep drawdowns. To understand the true growth trajectory of an asset, an investor must analyze the geometric progression of the investment.
This analysis examines the mechanics of CAGR, why it serves as the gold standard for measuring long-term performance, and how to identify the volatility drag that often remains hidden within high-growth portfolios.
Quick Facts
| Feature | Detail |
|---|---|
| Metric | Compound Annual Growth Rate (CAGR) |
| Primary Use | Smoothing volatile returns over multiple periods |
| Key Strength | Provides a single, annualized growth figure |
| Key Weakness | Ignores intra-period volatility and risk |
| Suitable For | Comparing disparate asset classes (e.g., Real Estate vs. S&P 500) |
What is Compound Annual Growth Rate (CAGR)?
Compound Annual Growth Rate is the constant rate of return required for an investment to grow from its beginning balance to its ending balance, assuming all profits were reinvested at the end of each period. Unlike a simple average, CAGR accounts for compounding, meaning the gains of one year become the principal for the next.
In live market conditions, assets rarely grow at a steady percentage. A Nasdaq-100 ETF might surge 30% in one calendar year, drop 15% the next, and remain flat for a third. CAGR strips away this noise to provide a hypothetical steady growth rate. It essentially asks: If this investment had grown at one consistent rate every year, what would that rate be?
This makes CAGR an essential tool for institutional researchers and retail investors when evaluating performance over any period longer than one year. It enables an apples-to-apples comparison between a volatile tech stock, a steady dividend-paying blue chip, and a physical real estate holding, regardless of their differing volatility profiles.
The Mechanics: How CAGR is Calculated
Calculating CAGR requires only three data points: the initial value of the investment, the final value, and the time horizon measured in years.
The formula is:
CAGR = [(Ending Value / Beginning Value)^(1 / Number of Years)] – 1
Breaking Down the Formula
The logic is rooted in the time-value of money (TVM) principle. By dividing the ending value by the beginning value, you determine the total growth factor. Raising this figure to the power of (1/n) effectively unwinds the compounding effect to isolate the single annual rate.
Example: The Real Estate Holding
Suppose an investor purchased a rental property for $200,000. After 10 years, the property is appraised at $350,000.
- Beginning Value: $200,000
- Ending Value: $350,000
- Years: 10
Calculation: ($350,000 / $200,000)^(1/10) – 1
Calculation: (1.75)^0.1 – 1
Result: 1.0575 – 1 = 5.75%
The property grew at a CAGR of 5.75%. This figure is far more useful than the total return of 75%, as it allows the investor to compare the property’s performance against other instruments, such as 10-year US Treasury yields or an S&P 500 index fund.
CAGR vs. Arithmetic Mean: Why the Difference Matters
A frequent error in retail investment analysis is the confusion between the arithmetic mean (simple average) and the geometric mean (CAGR). The arithmetic mean is the sum of yearly returns divided by the number of years. The geometric mean, which CAGR represents, accounts for the compounding effect of those returns.
Geometric Mean vs. Arithmetic Mean
The arithmetic mean consistently overstates the actual growth of a portfolio when volatility is present. This occurs because it fails to account for the mathematical reality that a loss of 50% requires a 100% gain just to return to the original break-even point.
Example: The Volatile Tech Stock
Consider a speculative stock over a two-year window:
- Year 1: +40%
- Year 2: -20%
Arithmetic Mean: (40% – 20%) / 2 = 10% per year.
Actual Result: If an investor started with $1,000, after Year 1 the balance is $1,400. In Year 2, the investor loses 20% of that $1,400, leaving a final balance of $1,120.
CAGR Calculation: - Ending Value: $1,120
- Beginning Value: $1,000
- Years: 2
($1,120 / $1,000)^(1/2) – 1 = (1.12)^0.5 – 1 = 5.83%
The gap between the average return (10%) and the actual growth rate (5.83%) is substantial. Relying on the arithmetic mean would lead an investor to believe their wealth is growing nearly twice as fast as it actually is.
The Impact of Volatility Drag and Variance Drain
In professional portfolio management, the discrepancy between the arithmetic mean and the CAGR is known as volatility drag or variance drain. This is a mathematical certainty: the higher the volatility of an asset, the greater the gap between its average return and its actual compound return.
Understanding Volatility Drag
Volatility drag occurs because losses have a disproportionate impact on the capital base. When a portfolio suffers a significant drawdown, the remaining capital must achieve a much higher percentage gain to return to the previous peak.
For instance, if a trader uses high leverage and suffers a 90% drawdown, they require a 900% gain to recover their initial principal. The arithmetic average of a -90% year and a +900% year is a staggering +405%, yet the CAGR is 0%. The investor has simply returned to their starting point after significant emotional and financial stress.
The Role of Variance Drain
Variance drain is the process by which the variance of returns reduces the geometric mean. This is why risk-adjusted returns, measured by tools like the Sharpe Ratio, are more critical than raw returns. A steady 7% return is mathematically superior to a volatile sequence of +20% and -6% returns, even if the arithmetic average appears similar.
Risk Warning: High-volatility assets, such as certain cryptocurrencies or leveraged ETFs, often showcase impressive average returns in marketing materials. Investors should always request the CAGR or the maximum drawdown to understand the actual wealth-generation potential of the strategy.
Practical Applications in Portfolio Analysis
CAGR is not merely a retrospective tool; it serves as a forward-looking benchmark for strategic asset allocation.
Comparing Disparate Asset Classes
Because CAGR annualizes returns, it allows for the comparison of assets with different liquidity profiles and holding periods. An investor can compare the CAGR of a 5-year private equity venture against the CAGR of a 5-year holding in a Vanguard Total Stock Market ETF.
Evaluating Fund Manager Performance
When analyzing a mutual fund or hedge fund, investors should look for the annualized return over 3, 5, and 10 years. These are CAGR figures. If a manager claims a high average return but the CAGR is significantly lower, it indicates a boom-and-bust strategy that may be too risky for a conservative portfolio.
Projecting Future Wealth
CAGR allows for the construction of realistic financial models. By using the historical CAGR of the S&P 500 (adjusted for inflation), an investor can project the future value of a portfolio using the formula:
Future Value = Present Value * (1 + CAGR)^n
| Component | Role in Projection |
|---|---|
| Present Value | The current capital invested |
| CAGR | The expected annualized growth rate |
| n | The number of years for the projection |
Limitations and Risks of Relying on CAGR
While CAGR is a powerful smoothing mechanism, it can be deceptive if used in isolation. It provides a straight line between two points, which hides the emotional and financial volatility of the journey.
The Blind Spot: Intra-Period Volatility
CAGR identifies where an investment started and where it ended, but it reveals nothing about the path taken. Two portfolios can have the exact same CAGR of 8% over five years, but one may have stayed steady while the other suffered a 40% drawdown in year three.
For an investor using a margin account or one nearing retirement, a 40% drawdown could trigger a margin call or force the liquidation of assets at the bottom of the market. These catastrophic events are completely ignored by the CAGR calculation.
The Sequence of Returns Risk
CAGR assumes a constant rate, but the order of returns matters immensely, particularly when withdrawals are involved. This is known as sequence of returns risk.
If a retiree experiences a heavy loss in the first two years of retirement, their portfolio may never recover, even if the long-term CAGR remains positive. The smoothed nature of CAGR masks the danger of early-stage losses during the decumulation phase.
Sensitivity to End-Dates
CAGR is highly sensitive to the start and end dates chosen. This is often exploited through cherry-picking performance data. A fund might show a brilliant CAGR from 2010 to 2020, but a dismal one from 2015 to 2020. Investors should analyze CAGR across multiple timeframes to ensure the performance is sustainable and not a result of a specific market anomaly.
CAGR Strategy: Benchmarking and Asset Comparison
To use CAGR effectively in a trading or investing strategy, it must be paired with other risk metrics. A professional analysis should follow this hierarchy:
- Determine the CAGR: Establish the smoothed annual growth rate.
- Analyze Maximum Drawdown (MDD): Identify the largest peak-to-trough decline. This reveals the cost of achieving that CAGR.
- Calculate the Calmar Ratio: Divide the CAGR by the Maximum Drawdown. A higher Calmar ratio indicates a more efficient return relative to the risk taken.
- Benchmark Against a Risk-Free Rate: Compare the CAGR to the current yield on 10-year US Treasuries. If the CAGR of a risky equity portfolio is only 2% higher than a risk-free Treasury, the risk premium is likely insufficient.
Applying CAGR to Different Instruments
- For Equities: Use CAGR to compare a stock’s growth against its sector index, such as comparing a semiconductor stock to the SOXX ETF.
- For Real Estate: Use CAGR to account for both rental yield and capital appreciation over the holding period.
- For Fixed Income: Use CAGR to evaluate the total return of a bond portfolio, including coupon payments and price fluctuations.
How do I calculate CAGR in Excel?
The most efficient method is using the RRI function: =RRI(nper, pv, fv), where nper is the number of periods, pv is the present value (beginning), and fv is the future value (ending). Alternatively, the formula can be entered manually: =((EndingValue/BeginningValue)^(1/Years))-1.
What is the difference between CAGR and annual return?
An annual return typically refers to the performance of a single specific year (e.g., The S&P 500 returned 12% in 2023). CAGR is the average annual return over a multi-year period, accounting for the effects of compounding.
Why is CAGR better than average return?
CAGR is superior because it reflects the geometric reality of money. Simple averages ignore the fact that losses reduce the capital available for future growth, whereas CAGR provides the actual rate at which wealth increased.
When should I use CAGR instead of ROI?
Use Return on Investment (ROI) for a snapshot of total gain (e.g., I made 50% on this trade). Use CAGR when the investment spans multiple years and you need to compare it to other annualized benchmarks or project future growth.
Can CAGR be negative?
Yes. If the ending value of an investment is lower than the beginning value, the CAGR will be negative. This indicates a compound annual loss over the specified period.
Is CAGR a reliable predictor of future performance?
No. CAGR is a lagging indicator; it describes what happened in the past. While it helps establish a historical baseline, it cannot account for future market shifts, regulatory changes, or black swan events.
Final Analysis
The Compound Annual Growth Rate is an indispensable tool for stripping away the noise of market volatility. By focusing on the geometric mean rather than the arithmetic average, investors can avoid the trap of overestimating their returns and better understand the impact of volatility drag on their capital.
However, the smoothing effect of CAGR is a double-edged sword. It provides clarity on growth but obscures the risk of the journey. To build a resilient portfolio, an investor should never rely on CAGR in isolation. It must be paired with maximum drawdown analysis and the Calmar ratio to ensure that growth is not being achieved at the cost of unsustainable risk.
As a next step, audit your current holdings. Calculate the CAGR for your top three positions over the last three years and compare them to a relevant benchmark, such as the S&P 500 or a sector-specific ETF. This will reveal whether active choices are adding genuine value or simply adding volatility.
Keep in mind that all market investments carry inherent risk, and historical CAGR is never a guarantee of future results. Proper position sizing and diversification remain the only true defenses against the volatility that CAGR seeks to smooth.
—
This article is for educational purposes only and does not constitute investment advice. Trading and investing carry risk of loss; never invest more than you can afford to lose. No returns are guaranteed.
Editorial Byline: Senior Financial Editor
Last reviewed: August 2026