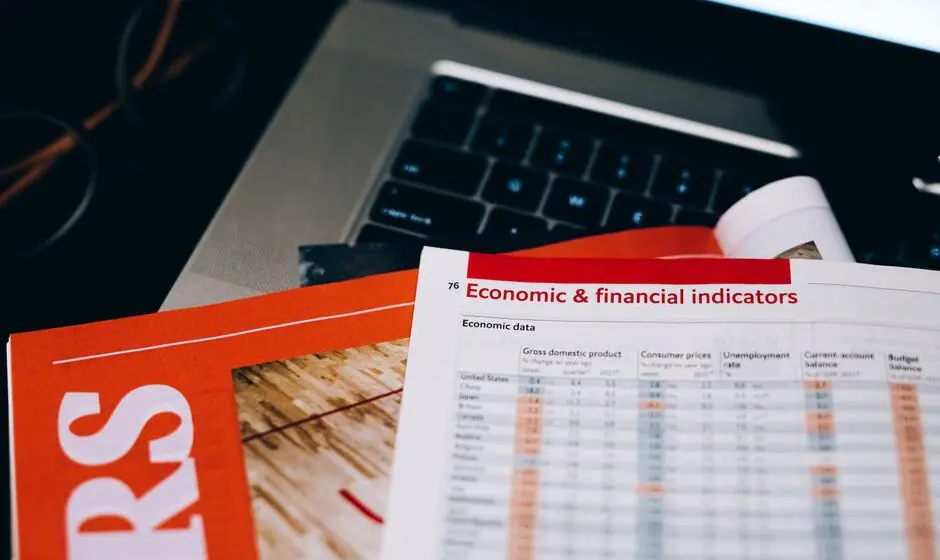
Economic Calendar: Key Indicators That Move Markets
Table of Contents
- The Role of the Economic Calendar in Active Trading
- Decoding the Calendar: Actual vs. Forecast vs. Previous
- High-Impact Indicators That Drive Volatility
- How Central Bank Decisions Shift Market Regimes
- Integrating the Calendar Into a Trading Strategy
- Managing Risks During High-Impact News Events
- Common Pitfalls When Trading the News
- Frequently Asked Questions
- Final Thoughts on Macro-Driven Trading
The Role of the Economic Calendar in Active Trading
Consider a scenario where you hold a long position in the USD/JPY pair. The price has been drifting sideways for several sessions, and your trade is comfortably in profit. Suddenly, at 8:30 AM EST, a single data point hits the wires. Within seconds, the pair drops 80 pips, blowing past your stop-loss due to a massive liquidity gap. You did not miss a technical signal or a chart pattern; you missed a date on the economic calendar.
For the professional trader, an economic calendar is not merely a schedule of dates. It is a volatility map. It identifies the precise moments when the market is likely to transition from a low-volatility drift to a high-volatility shock. Institutional algorithms are programmed to react to these specific timestamps, often triggering rapid price expansions that can either accelerate an existing trend or spark a violent reversal.
Integrating an economic calendar into your workflow transforms it from a passive reference into a predictive tool. By understanding the mechanics of data releases, the specific indicators that move the needle for the Federal Reserve or the European Central Bank, and the behavior of liquidity providers, you can protect your capital when news hits the tape.
Quick Facts
| Feature | Detail |
|---|---|
| Primary Use | Anticipating volatility and liquidity shifts |
| Key Data Sources | Government agencies (BLS, BEA) and Central Banks |
| Impact Levels | Low, Medium, and High (often color-coded) |
| Critical Timeframes | Seconds to hours following a release |
| Suitable For | Day traders, swing traders, and portfolio managers |
Decoding the Calendar: Actual vs. Forecast vs. Previous
To use an economic calendar effectively, you must recognize that the market rarely reacts to the actual number in isolation. Instead, price action is driven by the deviation from expectations.
The Forecast (The Consensus)
The forecast represents the median expectation of a group of economists and analysts. In financial terms, this number is already priced in. If the market expects inflation to be 3.1% and the actual result is 3.1%, the price may not move at all. In some cases, it may even move in the opposite direction as traders sell the news, closing positions they opened in anticipation of the event.
The Actual (The Reality)
The actual value is the hard data released by the government or institution. The gap between the forecast and the actual is where the volatility lives. A significant beat or miss triggers a rapid repricing of assets as market participants adjust their assumptions about future interest rates and macroeconomic health.
The Previous (The Trend)
The previous value provides the trajectory. A number might beat the forecast but still be lower than the previous month’s print. This suggests a slowing trend, which can lead to a fake-out. In this scenario, the price spikes initially on the beat, then reverses as the market realizes the broader trend remains bearish.
Example: If the forecast for a GDP print is 2.0%, the previous was 2.5%, and the actual comes in at 2.2%, the market sees a beat relative to expectations but a slowdown relative to the trend. This nuance often separates professional analysis from retail guesswork.
High-Impact Indicators That Drive Volatility
Not all data points are created equal. While a retail sales report might cause a flicker in price, certain Tier 1 indicators can shift the entire direction of a currency or equity market for weeks.
Non-Farm Payrolls (NFP) and Labor Market Dynamics
Released by the U.S. Bureau of Labor Statistics, the NFP report is perhaps the most anticipated monthly event for forex and gold traders. It measures the number of jobs added in the US economy, excluding the farming sector.
A strong NFP print suggests a robust economy, which typically gives the Federal Reserve room to raise interest rates to combat inflation. This usually strengthens the USD. Conversely, a significant miss can signal economic weakness, leading to a dovish shift in policy and a weaker dollar.
Practical Scenario: A trader scalping gold (XAU/USD) during NFP often observes a whipsaw. The price may spike in both directions within seconds as liquidity providers widen their spreads to protect themselves from the volatility.
Consumer Price Index (CPI) and Inflationary Expectations
CPI is the primary gauge for inflation. In the current macroeconomic regime, CPI is the North Star for markets. Because central banks have a mandate to maintain price stability, CPI prints dictate the path of interest rates.
When CPI comes in higher than forecast, the market anticipates a hawkish response, meaning higher rates. This typically boosts the domestic currency but puts downward pressure on equities and bonds, as borrowing costs rise and the discount rate for future earnings increases.
Practical Scenario: An investor hedging an equity portfolio ahead of a high-inflation CPI print might buy put options on the S&P 500 or increase their allocation to Treasury Inflation-Protected Securities (TIPS) to offset potential losses.
Retail Sales and GDP
While less volatile than CPI or NFP, Gross Domestic Product (GDP) and Retail Sales provide the big picture of economic health. GDP measures the total value of goods and services produced. Retail sales act as a proxy for consumer spending, which drives the bulk of the US economy.
A consistent miss in retail sales can signal an impending recession, causing a shift from risk-on assets, such as tech stocks and high-yield currencies, to safe havens like the USD, CHF, and Gold.
How Central Bank Decisions Shift Market Regimes
While data prints provide the fuel, central bank decisions provide the engine. The most critical event on any economic calendar is the interest rate decision and the accompanying policy statement.
Interest Rate Decisions and the Carry
Interest rates determine the cost of money. In the forex market, this creates carry. If the Bank of Japan keeps rates at 0% while the Federal Reserve raises them to 5%, the interest rate differential makes the USD highly attractive relative to the JPY.
Practical Scenario: Trading the USD/JPY pair during a surprise Federal Reserve rate hike. If the Fed raises rates more than the market anticipated, the USD/JPY will likely spike upward as capital flows toward the higher-yielding currency.
Forward Guidance and the Dot Plot
The actual rate change is often less important than the forward guidance, which is the central bank’s communication about future moves. The Fed’s Dot Plot is a visual representation of where each official expects rates to be in the coming years.
A hawkish tone means the bank is inclined to raise rates to fight inflation. A dovish tone means they are inclined to lower rates to stimulate growth. A hawkish pause occurs when the bank keeps rates steady but signals that further hikes are still possible.
The Press Conference
Volatility often peaks not during the rate announcement, but 30 minutes later during the press conference. A single phrase from the Fed Chair can invalidate the previous hour’s price action. Professionals often wait for the press conference to confirm the narrative before committing significant capital.
Integrating the Calendar Into a Trading Strategy
Using an economic calendar is not about guessing the number; it is about managing your exposure to the event.
The Wait and See Approach (Post-Release)
This is the most conservative strategy. The trader ignores the forecast and waits for the actual data to be released. Once the initial spike occurs and the market settles into a direction, the trader enters a position. This avoids the risk of being on the wrong side of a surprise but requires accepting a slightly worse entry price.
The Straddle Strategy (Volatility Play)
For those trading options or using tight stops, a straddle involves placing both a buy-stop and a sell-stop order above and below the current price just before a high-impact release. The goal is to capture the explosive move in either direction.
Risk Warning: This strategy is dangerous in choppy markets where the price triggers both stops and then returns to the center, resulting in two losses.
The Fundamental Alignment (Trend Following)
The most successful institutional traders align the calendar with the long-term trend. If the macro trend is bullish for the USD and a medium-impact report comes in slightly negative, they use that dip as a buying opportunity, knowing the overarching policy regime remains hawkish.
| Strategy | Risk Level | Primary Goal | Best Market Condition |
|---|---|---|---|
| Wait and See | Low | Directional Confirmation | High Volatility |
| Straddle | High | Volatility Capture | Binary Outcomes |
| Fundamental Alignment | Medium | Trend Continuation | Strong Macro Trend |
Managing Risks During High-Impact News Events
Volatility is a double-edged sword. While it provides the movement necessary for profit, it can wipe out an account through slippage and spread expansion.
The Danger of Slippage
During a high-impact event like NFP, liquidity can vanish in milliseconds. This leads to slippage, where your stop-loss is not triggered at your specified price, but at the next available price. If you have a stop at 1.1000, but the market gaps down to 1.0950, you will be filled at 1.0950, resulting in a larger loss than planned.
Spread Expansion
Liquidity providers and brokers increase the spread, the difference between the bid and ask price, during news events to protect themselves. A spread that is normally 1 pip might jump to 20 pips. This can trigger your stop-loss even if the price does not actually reach your level.
Position Sizing and the News Buffer
To survive high-impact events, professional traders employ two main tactics:
- Reducing Exposure: Cutting position sizes by 50% or more before a Tier 1 release to lower the potential drawdown.
- Widening Stops: Moving stop-losses further away from the current price to avoid being stopped out by a temporary volatility spike.
Common Pitfalls When Trading the News
Even experienced traders fall into traps when the economic calendar becomes the primary driver of their decisions.
Over-reliance on the Forecast
The forecast is an average, not a prophecy. Many traders treat the forecast as a certainty and take massive positions. When the actual deviates wildly, they are caught in a liquidity trap with no exit.
Ignoring the Secondary Data
A headline number might be positive, but the underlying data might be weak. For example, the NFP might show jobs were added, but the Average Hourly Earnings, a measure of wage inflation, might be falling. The market may initially spike on the jobs number, then crash as it digests the wage data.
Revenge Trading After a Whipsaw
Getting stopped out by a news spike often leads to emotional trading. Traders try to win back their loss by entering a massive position in the opposite direction without waiting for the market to stabilize. This is a fast track to a blown account.
Key Takeaway: The goal of using an economic calendar is not to predict the future, but to ensure you are not the liquidity that institutional traders use to fill their large orders.
Frequently Asked Questions
How do I read an economic calendar for the first time?
Start by filtering for High Impact events only. Look at the currency or country involved, the time of release, and the Forecast vs. Previous columns. Focus on the most influential indicators—CPI, NFP, and Interest Rate decisions—before trying to analyze lower-tier data.
What are the most important economic indicators to watch?
For USD-based markets, the Big Three are Non-Farm Payrolls (employment), Consumer Price Index (inflation), and the Federal Open Market Committee (FOMC) rate decisions. For the Eurozone, watch the ECB rate decisions and German ZEW sentiment.
Why does the market sometimes move opposite to the data release?
This is often due to priced-in expectations or a sell the news event. If the market has already rallied for a week in anticipation of a positive report, the actual positive report provides the catalyst for traders to take profits and exit their positions.
When is the best time to enter a trade relative to a news event?
For most retail traders, the safest entry is 15 to 30 minutes after the release. This allows the initial volatility to subside, the spreads to tighten, and a clear directional trend to emerge based on how the market has digested the data.
Can an economic calendar predict stock market crashes?
It cannot predict a Black Swan event, but it can signal the conditions for a crash. For example, a series of unexpectedly high CPI prints combined with a hawkish Fed shift can create the environment where equity valuations become unsustainable, leading to a correction.
Is it better to trade before or after a high-impact news release?
Trading before is a gamble on the outcome; trading after is a trade on the market’s reaction. Professionals generally prefer the latter, as it removes the binary risk of the data print and allows them to trade the actual price action.
Final Thoughts on Macro-Driven Trading
The economic calendar is the heartbeat of the financial markets. By understanding the relationship between data, central bank policy, and liquidity, you move from being a passive observer to an active strategist. The shift from guessing the number to managing the volatility is the hallmark of a professional approach.
As a next step, begin logging your trades alongside the economic calendar. Note how your positions reacted during high-impact events and whether your stop-losses were hit due to trend changes or mere spread expansion.
Keep in mind that no indicator is infallible. Macroeconomic data is often revised weeks after the initial release, and market sentiment can override fundamentals for extended periods. Always prioritize capital preservation over the lure of a news spike.
Further Reading & Official Resources:
- U.S. Bureau of Labor Statistics (BLS) – Source for NFP and CPI data.
- CME Group – For FedWatch tool and interest rate probabilities.
-
SEC – For guidelines on market volatility and investor protection.
This article is for educational purposes only and does not constitute investment advice. Trading and investing carry risk of loss; never invest more than you can afford to lose. No returns are guaranteed.
Editorial Byline: Senior Financial Editor
Last reviewed: August 2026