Asset Allocation: How to Balance Risk and Growth | TraderZO
Table of Contents
- The Mechanics of Asset Allocation
- Core Frameworks for Portfolio Construction
- Strategic vs. Tactical Asset Allocation
- Managing Correlation and Volatility
- Practical Examples by Investor Profile
- The Rebalancing Process: Maintaining Your Target
- Common Pitfalls in Portfolio Balancing
- Frequently Asked Questions
- Final Analysis
The Mechanics of Asset Allocation
Consider a portfolio concentrated entirely in high-growth technology equities. During a secular bull market, the returns appear exceptional, often outpacing broad indices. However, when the Federal Reserve pivots to a hawkish stance, raising interest rates to curb inflation, the valuation multiples of these growth stocks compress. In such a scenario, a portfolio lacking diversification may experience a 30% drawdown in a matter of weeks. This is the primary risk of poor asset allocation: the failure to distribute capital across distinct categories to mitigate systemic shocks.
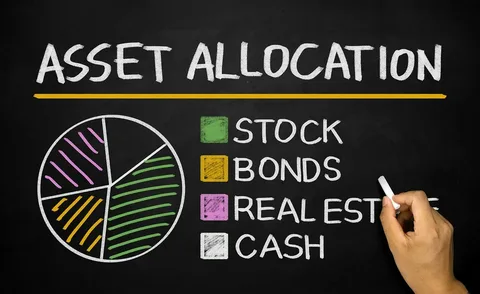
Asset allocation is the systematic process of dividing an investment portfolio among different asset categories, such as equities, fixed income, cash, and real assets. While security selection focuses on the micro level—deciding which specific company or bond to purchase—asset allocation operates at the macro level, determining the weight of each asset class. Empirical data suggests that the allocation decision has a far more significant impact on long-term returns and volatility than the selection of individual securities.
Moving beyond the simplistic adage of not putting all your eggs in one basket requires a rigorous framework. Effective portfolio management involves understanding the mathematical basis for balancing risk, distinguishing between strategic and tactical shifts, and establishing clear triggers for rebalancing. By managing the weights of various assets, an investor can control the portfolio’s sensitivity to specific macroeconomic factors, such as interest rate volatility or equity market corrections.
Quick Facts
- Primary Goal: Optimize the risk-return trade-off to maximize efficiency.
- Core Assets: Equities, Fixed Income (Bonds), Cash/Cash Equivalents, Real Estate, and Commodities.
- Risk Driver: The interplay between asset class volatility and their mutual correlations.
- Key Metric: The Sharpe Ratio, used to measure risk-adjusted returns.
- Suitable For: All market participants, from retail traders to institutional pension funds.
Core Frameworks for Portfolio Construction
Constructing a professional portfolio requires more than intuition; it demands a framework that aligns an investor’s financial capacity for loss with their objective for growth. Institutional analysts typically rely on quantitative models to identify an optimal mix that minimizes unnecessary risk.
Modern Portfolio Theory (MPT) and the Efficient Frontier
Modern Portfolio Theory, pioneered by Nobel laureate Harry Markowitz, posits that it is possible to construct an efficient portfolio—one that offers the maximum expected return for a specific level of risk. The graphical representation of these optimal portfolios is known as the Efficient Frontier.
The logic is rooted in diversification. If an investor holds only government bonds, the risk is low, but the growth potential is capped by low yields. Conversely, a portfolio of 100% equities offers high growth potential but exposes the investor to extreme volatility. MPT demonstrates that by combining assets that do not move in perfect lockstep, an investor can shift their portfolio position toward the upper-left of the risk-return graph. This allows for the achievement of higher returns without a proportional increase in total portfolio volatility.
The Role of the Sharpe Ratio
To determine if an allocation is truly balanced, professionals employ the Sharpe ratio. This metric calculates the excess return of a portfolio over the risk-free rate—typically the current yield on U.S. Treasury bills—divided by the portfolio’s standard deviation (a measure of volatility).
If two portfolios both yield an 8% annual return, but Portfolio A exhibits a volatility of 10% while Portfolio B exhibits 20%, Portfolio A is the superior choice from a risk-adjusted perspective. A disciplined asset allocation strategy seeks to maximize this ratio, ensuring the investor is not assuming excessive risk to achieve a given return.
| Metric | Focus | Primary Objective |
|---|---|---|
| Efficient Frontier | Risk vs. Return | Find the maximum return for a set risk level |
| Sharpe Ratio | Risk-Adjusted Return | Measure excess return per unit of volatility |
| Standard Deviation | Volatility | Quantify the dispersion of returns from the mean |
Strategic vs. Tactical Asset Allocation
Portfolio management generally falls into two categories: a long-term structural blueprint and short-term opportunistic adjustments.
Strategic Asset Allocation (SAA)
Strategic allocation serves as the baseline policy. It is a long-term framework that defines target percentages based on an investor’s time horizon and risk tolerance. For instance, a long-term investor might establish a strategic target of 70% equities and 30% fixed income.
This approach is designed to filter out short-term market noise. If the S&P 500 drops 10% in a single month, the strategic investor does not react impulsively. They recognize that their long-term target remains 70% equities and may view the price correction as an opportunity to accumulate more shares to maintain the target ratio.
Tactical Asset Allocation (TAA)
Tactical allocation is an active management strategy. It allows the manager to deviate from strategic targets to capitalize on specific market conditions, macroeconomic trends, or perceived mispricings.
Consider a scenario where inflation is accelerating and the European Central Bank (ECB) is lagging in its rate hikes. A tactical manager might temporarily reduce exposure to long-duration bonds, which lose value as rates rise, and increase allocations to commodities or Treasury Inflation-Protected Securities (TIPS). Once the macroeconomic environment stabilizes or the trade thesis is realized, the manager rotates the funds back to the strategic baseline.
Risk Warning: Tactical allocation requires deep market expertise and a keen understanding of macroeconomic indicators. Frequent shifting can lead to increased transaction costs and higher tax liabilities, which can significantly erode the gains achieved through the tactical shift.
Managing Correlation and Volatility
The efficacy of a balanced portfolio depends not on the number of assets held, but on how those assets behave relative to one another. This relationship is quantified by the correlation coefficient, which ranges from -1.0 to +1.0.
Understanding Correlation Coefficients
- Positive Correlation (+1.0): Two assets move in the same direction. Holding two different large-cap technology stocks usually results in high positive correlation.
- Zero Correlation (0): The assets exhibit no linear relationship in their price movements.
- Negative Correlation (-1.0): The assets move in opposite directions. Historically, high-quality government bonds have often shown a negative correlation with equities during market crashes, a phenomenon known as the flight to quality.
During the 2020 market crash, equities plummeted globally. Simultaneously, long-term U.S. Treasuries surged as investors sought the safety of the sovereign debt market. A portfolio balanced with both assets experienced a significantly smaller total drawdown than a portfolio concentrated solely in stocks.
Volatility Regimes and Asset Behavior
Assets behave differently depending on the prevailing market regime. In a low-inflation, growth-oriented regime, equities typically lead the market. In a stagflationary regime—characterized by high inflation and stagnant growth—traditional 60/40 portfolios often struggle because stocks and bonds may decline simultaneously.
To mitigate this, sophisticated investors incorporate non-correlated assets. Gold, managed futures, or specific real estate holdings often maintain their value or appreciate when traditional financial assets fail. Integrating these assets lowers overall portfolio volatility without necessarily sacrificing all growth potential.
| Asset Pair | Typical Correlation | Behavior in Crisis |
|---|---|---|
| S&P 500 / Nasdaq 100 | High Positive | Move together |
| Equities / Long-term Treasuries | Often Negative | Treasuries often rise as stocks fall |
| Equities / Gold | Low to Negative | Gold acts as a hedge/store of value |
| Equities / REITs | Moderate Positive | Both sensitive to growth/rates |
Practical Examples by Investor Profile
Asset allocation must be tailored to an investor’s capacity for loss—the maximum amount of capital they can afford to lose without compromising their standard of living or financial goals.
The Aggressive Growth Profile (Early Career)
An investor in their 30s typically possesses a long time horizon, allowing them to recover from significant short-term drawdowns. Their primary objective is capital appreciation.
- Equities (80%): Diversified across US Large Cap (S&P 500), Mid/Small Cap, and Emerging Markets to capture global growth.
- REITs (15%): Real Estate Investment Trusts provide a hedge against inflation and a distinct income stream.
- Cash/Money Market (5%): A liquidity buffer used for opportunistic buying during market dips.
In this profile, the heavy equity weighting drives long-term growth, while REITs provide a diversification benefit away from pure corporate equity risk.
The Preservation Profile (Near Retirement)
An investor in their 60s cannot afford a 40% portfolio drawdown immediately prior to or during the withdrawal phase. The objective shifts from aggressive growth to income generation and capital preservation.
- Dividend-Paying Stocks (30%): Provides moderate growth and a steady stream of cash flow.
- Investment Grade Bonds (50%): Reduces overall volatility and provides predictable coupon payments.
- TIPS (10%): Treasury Inflation-Protected Securities ensure that purchasing power is not eroded by rising consumer prices.
- Cash Equivalents (10%): High liquidity to cover 1–2 years of living expenses, removing the need to sell assets during a bear market.
This allocation prioritizes the floor of the portfolio over the ceiling, focusing on stability.
The Rebalancing Process: Maintaining Your Target
Over time, market movements will inevitably push a portfolio away from its target allocation. If equities experience a strong year, a 70/30 portfolio may drift to 80/20. At this point, the investor is unknowingly taking on more risk than originally intended.
Calendar-Based Rebalancing
This is the most straightforward method. The investor reviews the portfolio at set intervals—quarterly or annually—and trades assets to return to the target percentages. While simple, this method is blunt; it may trigger trades and fees even if the portfolio has only drifted by a negligible percentage.
Threshold-Based Rebalancing (The Band Method)
Professional fund managers often utilize rebalancing bands. A percentage limit (e.g., +/- 5%) is set for each asset class. A trade is only triggered when an asset exceeds that band.
Example:
- Target: 60% Equities / 40% Bonds.
- Band: 5%.
- Trigger: If equities rise to 65% or fall to 55%, the manager rebalances.
This method is more efficient as it ignores minor fluctuations but mandates action during significant market moves. It systematically forces the investor to sell high (selling the outperforming asset) and buy low (buying the lagging asset).
Cash-Flow Rebalancing
For investors who are still contributing to their accounts, the most tax-efficient way to rebalance is through new capital. Instead of selling winning positions—which triggers capital gains taxes in taxable accounts—the investor directs new monthly deposits into the asset class that is currently underweight.
Common Pitfalls in Portfolio Balancing
Even experienced investors can fall into traps that undermine their asset allocation strategy.
The Diversification Illusion
Holding ten different mutual funds does not guarantee diversification if all ten funds hold the same top holdings, such as Apple, Microsoft, and Nvidia. This is known as overlap. When the technology sector corrects, all ten funds will decline in tandem. True asset allocation requires diversification across distinct asset classes, not just a collection of similar funds.
Chasing Past Performance
A frequent error is increasing the allocation to the asset class that performed best in the previous year. This is the antithesis of a balanced strategy. Entering a position after a massive run-up often means buying at the peak of a market cycle, which increases the probability of a significant drawdown.
Ignoring the Hidden Correlation
During extreme systemic crises, such as the 2008 financial crisis, correlations often go to one. This means almost every risk asset—except cash and high-quality government bonds—falls simultaneously. Investors who believed they were balanced across different equity sectors found that in a liquidity crisis, everything becomes correlated. This underscores the importance of holding a dedicated cash or short-term Treasury position for survival.
Key Takeaway: Diversification is effective during normal market cycles, but in a systemic liquidity event, only liquidity (cash) provides a true hedge.
Frequently Asked Questions
How do I determine my risk tolerance for asset allocation?
Risk tolerance is a synthesis of your emotional ability to endure losses and your financial capacity to sustain them. To assess this, ask: If my portfolio dropped 20% in a single month, would I sell in a panic, or would I view it as a buying opportunity? Additionally, consider your time horizon; the longer the period before you need the funds, the higher your risk capacity generally is.
What is the difference between asset allocation and diversification?
Asset allocation is the high-level strategic decision of how to split capital between broad categories, such as 60% stocks and 40% bonds. Diversification is the tactical execution within those categories—for example, owning 50 different stocks across 10 different industries rather than a single company. Allocation is the strategy; diversification is the implementation.
Why should I rebalance my portfolio periodically?
Rebalancing prevents style drift, where a portfolio becomes accidentally over-exposed to risk because one asset class outperformed others. It also enforces a disciplined buy low, sell high regime. Without rebalancing, a winning asset will eventually dominate the portfolio, leaving the investor exposed to a massive crash if that specific asset class corrects.
When should I shift from growth to income assets?
This transition typically occurs as you approach a major financial milestone, such as retirement. A common rule of thumb is to begin gradually increasing the allocation to fixed income and cash 5–10 years before the funds are required. This protects the accumulated principal from sequence of returns risk—the danger of a market crash occurring exactly when you begin withdrawals.
Can a 60/40 portfolio still work in a high-inflation environment?
The traditional 60% stock / 40% bond portfolio can struggle during periods of high inflation because inflation often compresses stock valuations and lowers bond prices as yields rise. To adapt, investors often replace a portion of the bond allocation with inflation-sensitive assets like TIPS, commodities, or real estate, which tend to preserve value more effectively when prices rise.
Is target-date fund allocation sufficient for retirement?
For many passive investors, target-date funds are a viable starting point because they automate the glide path from growth to preservation. However, they are blind to individual circumstances, such as other income sources (Social Security, pensions) or specific risk appetites. A customized asset allocation usually offers better tax efficiency and a more precise risk profile.
Final Analysis
Asset allocation is the most potent tool an investor possesses to control the volatility of their financial future. By focusing on the broad distribution of capital rather than the pursuit of a single winning security, you align your portfolio with the mathematical realities of risk and reward.
The most successful portfolios are not those that achieve the highest possible return in a single calendar year, but those that avoid catastrophic drawdowns and remain consistent over several decades. Whether employing a strict strategic approach or a flexible tactical one, the objective remains the same: ensuring that no single market event can erase years of progress.
As a next step, conduct an audit of your current holdings. Calculate the actual percentage of your portfolio in equities, bonds, and cash. If you find you have drifted more than 5% from your target, consider rebalancing through your next contribution or a strategic trade.
Keep in mind that all investing involves risk. No allocation strategy can guarantee a profit or completely eliminate the possibility of loss, especially during systemic market failures. Always align your risk exposure with your actual financial needs and time horizon.
***
This article is for educational purposes only and does not constitute investment advice. Trading and investing carry risk of loss; never invest more than you can afford to lose. No guaranteed returns are implied.
Editorial Byline: Senior Financial Editor
Last reviewed: August 2026