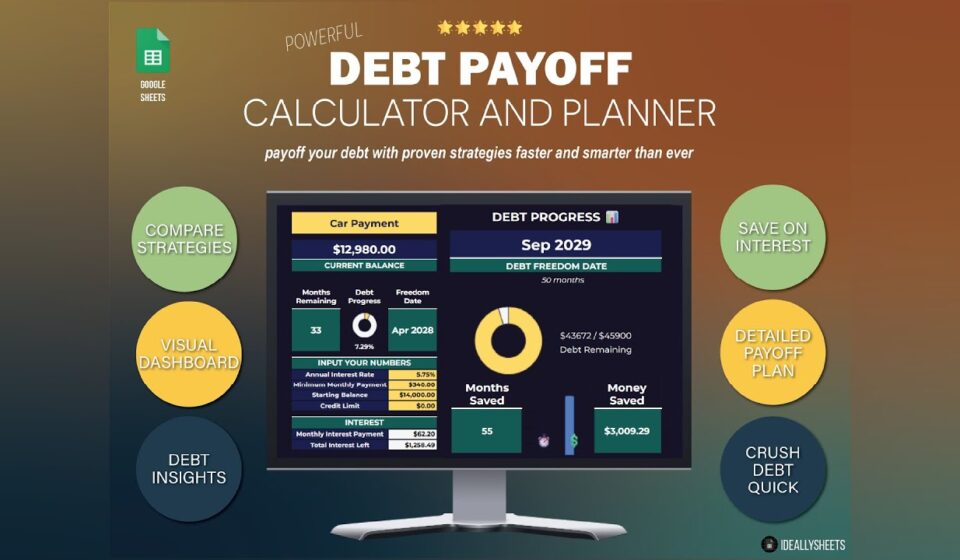
Debt Payoff Calculator: Build a Plan to Cut Interest
Table of Contents
- What a Debt Payoff Calculator Actually Does
- The Core Mechanics: Amortization, Principal, and Interest
- Strategy 1: The Debt Avalanche Method
- Strategy 2: The Debt Snowball Method
- Avalanche vs. Snowball: A Real Cost Comparison
- The Power of Extra Payments
- When Interest Rates Aren’t Fixed
- Debt Payoff vs. Debt Consolidation
- Common Mistakes That Break a Payoff Plan
- Building a Working Plan in Five Steps
- Frequently Asked Questions
- Conclusion
Introduction
A household carrying three credit cards, a car loan, and a federal student loan balance rarely sees the full shape of what it owes. Each statement shows a minimum payment, a balance, and an APR, but none of them explain how those numbers interact over the next four years. A debt payoff calculator is the tool that forces those numbers into one timeline. It takes the balances, the rates, and the monthly payment you can actually afford, then shows you, month by month, when the last balance disappears and how much of every dollar went to interest rather than principal.
That last figure is the one most borrowers underestimate. Credit card interest compounds daily, and on balances above 18% APR, a household can easily pay more in interest over a payoff period than the original charge that created the balance. Federal student loans are cheaper, but the same compounding logic still applies across a ten-year amortization window. The math behind any debt payoff calculator is borrowed from the same standard loan amortization formula used by mortgage underwriters, Federal Reserve economists, and Federal Student Aid repayment estimators. The question is not whether the formula is right. The question is which inputs you feed it, and which strategy you choose once the timeline is in front of you.
This guide explains how a debt payoff calculator works, how to read its output, and where the trade-offs between avalanche, snowball, consolidation, and extra payments actually fall. Two worked scenarios run through the analysis: a $28,500 three-card household and a $42,000 federal student loan borrower comparing repayment terms.
From raw balances to a payoff timeline
At its core, a debt payoff calculator runs the same equation a mortgage lender uses. For each debt, you supply three numbers: the current balance, the annual percentage rate (APR), and the planned monthly payment. The calculator then solves for the number of months required to drive the balance to zero, given that interest accrues on the remaining principal each month.
The output is a four-part table: total months to payoff, total interest paid, the date of the final payment, and a month-by-month amortization schedule showing how each payment splits between interest and principal. Most calculators also let you run a side-by-side comparison. You can see what happens if you add $200 to one card, shift everything to the highest-rate balance, or extend the term by six months to free up cash flow. That comparison view is where the real planning happens.
The three numbers you need to start
Before opening any tool, gather three pieces of information for every debt you carry: the current statement balance, the APR printed on the statement, and the minimum payment due. The minimum payment is the floor. Most borrowers who actually want to eliminate debt pay more than the minimum, and the calculator will let you test any figure above it.
A useful pre-step is to compute a weighted average APR. Multiply each balance by its rate, sum the products, and divide by the total balance. For the $28,500 three-card household in our scenario, that weighted rate works out to roughly 20.6%, a more honest summary than any single card’s rate. You will use this number when comparing payoff strategies to a potential consolidation loan.
Risk Warning: A debt payoff calculator is only as accurate as the inputs. Variable-rate cards, promotional 0% APR offers, and fees charged by the issuer are common sources of drift between projected and actual payoff dates.
The Core Mechanics: Amortization, Principal, and Interest
How monthly payments actually split
Every fixed-rate installment loan follows the same pattern. In the early months, most of the payment covers interest and only a small slice reduces principal. In the later months, the ratio flips. A $30,000 auto loan at 7% over five years, for example, sends roughly 70% of the first payment to interest and only 30% to principal. By the final year, the split is closer to 90/10 in favor of principal.
The formula driving this is the standard amortization equation:
M = P × [r(1+r)^n] / [(1+r)^n − 1]
where M is the monthly payment, P is the principal, r is the monthly interest rate (APR divided by 12), and n is the number of months. A debt payoff calculator solves this for n when you supply M, P, and r, then iterates month by month to show the declining balance.
Why early payments feel like they barely dent the balance
On a 19.99% APR card with a $5,000 balance and a $150 minimum payment, roughly $83 of the first payment goes to interest and only $67 reduces the principal. At that pace, the balance would take more than four years to clear, and the total interest would exceed the original balance. This is the mechanism that turns a manageable balance into a multi-year drag on cash flow.
The arithmetic is unforgiving, and it is the reason minimum payments alone almost never eliminate revolving debt. The Consumer Financial Protection Bureau (https://www.consumerfinance.gov/) publishes disclosures showing how long minimum-only payments take on representative card balances, and the timelines are consistently measured in decades for balances above a few thousand dollars.
Strategy 1: The Debt Avalanche Method
Targeting the highest APR first
The avalanche method directs every extra dollar above the minimum payment to the debt with the highest APR, while paying the minimum on everything else. Once the highest-rate balance is paid off, the freed-up payment rolls into the next-highest-rate balance, and so on. The strategy is mathematically optimal: it produces the lowest total interest paid and the shortest payoff timeline of any single-debt ordering.
A worked example with three credit cards
Take the household carrying $28,500 across three cards:
| Card | Balance | APR | Minimum Payment |
|---|---|---|---|
| Card A | $12,000 | 19.99% | $240 |
| Card B | $9,500 | 24.49% | $200 |
| Card C | $7,000 | 16.99% | $140 |
Total minimum payments: $580 per month. Suppose the household can free up an extra $400, bringing the total monthly budget to $980.
Under the avalanche method, the $580 in minimums is paid across all three cards, and the $400 extra is sent entirely to Card B at 24.49%. Card B is retired in roughly 22 months. The $600 that was previously split between B and the minimums is then redirected to Card A. Card A clears about 26 months later. Card C, the lowest-rate balance, is paid off last on its minimum schedule and finishes around the 60-month mark. Total interest across all three cards under avalanche lands near $11,200.
Strategy 2: The Debt Snowball Method
Building momentum through quick wins
The snowball method reorders the same cash flow. Instead of attacking the highest APR first, it targets the smallest balance. Card C, at $7,000, is paid off first. The $140 minimum plus the $400 extra goes there, and Card C is retired in roughly 14 months. The $540 of freed-up payment then hits Card A, and once Card A is done, the full $1,120-plus available flow goes to Card B.
Where the behavioral trade-off enters
Snowball produces a longer timeline and slightly higher total interest, in this case closer to $12,400 across the same five-year window. The savings gap is meaningful but not enormous, often in the high-hundreds to low-thousands of dollars for portfolios of this size. The argument for snowball is psychological: borrowers who clear a balance inside 15 months tend to stick with the plan. Behavioral research on goal-gradient motivation, often cited in personal finance literature, suggests visible progress increases follow-through, and a cleared balance is the most visible progress available.
The choice between avalanche and snowball is rarely about which is “best” in the abstract. It is about which one the borrower will actually execute for the next four or five years.
Avalanche vs. Snowball: A Real Cost Comparison
Running both strategies on the same $28,500 portfolio
The same $980 monthly budget, applied to the same three balances, produces two different end states:
| Strategy | Order | Total Interest | Final Payment |
|---|---|---|---|
| Avalanche | B → A → C | ~$11,200 | ~Month 60 |
| Snowball | C → A → B | ~$12,400 | ~Month 63 |
The interest differential in this scenario is on the order of $1,200, a real but not catastrophic number. The timeline differential is roughly three months. The avalanche method wins on both, but the margin is narrower than most calculators suggest, because the highest-rate balance is not always the largest one, and because the weighted average rate across the portfolio matters more than any individual APR.
What changes when the math meets the human
Where the strategies diverge sharply is in the experience. Avalanche requires paying the minimum on the small balances for more than a year while the extra dollars attack a balance that may feel no more urgent than the others. Snowball produces an early win that resets the borrower’s relationship to the plan. For households with tight cash flow, irregular income, or a history of stopping and restarting, that early win can matter more than $1,200 in interest savings. For households with stable income and a high tolerance for delayed gratification, the avalanche math is the right answer.
The Power of Extra Payments
Where an extra $200 actually goes
Returning to the avalanche scenario, suppose the household increases the extra payment from $400 to $600. That single change cascades through the schedule. Card B retires a few months sooner, the rolled-over payment hits Card A earlier, and the final balance on Card C is reached months ahead of the original 60-month projection. Across the full portfolio, an extra $200 per month typically shaves the timeline by close to a year and total interest by roughly $2,500 in a setup of this size. The exact numbers move with rate changes, but the directional effect is consistent.
The break-even question: prepay debt or invest?
For borrowers with high-rate card debt, the math almost always favors prepayment. A 20% APR guarantee from the card issuer beats the expected return on most diversified portfolios, and Federal Reserve historical data on long-run equity returns, adjusted for inflation, sits well below 20% on a risk-adjusted basis. Once the highest-rate balances are cleared, the question changes. A borrower with a 5.8% federal student loan balance has a more interesting trade-off, because the guaranteed after-tax return from paying down that 5.8% debt is comparable to a moderate allocation in a tax-advantaged retirement account, and the comparison depends on the borrower’s marginal tax bracket, employer match availability, and time horizon. Most planners recommend capturing any employer match first, eliminating high-rate revolving debt second, and then choosing between prepayment and investing based on rate comparisons.
When Interest Rates Aren’t Fixed
Variable APR cards and promotional offers
Standard amortization assumes a fixed APR. Real credit cards rarely work that way. Most variable-rate cards reset monthly based on the prime rate plus a margin, and the rate can move with Federal Reserve policy changes. Promotional 0% APR offers on balance transfers are another common distortion. A card showing 0% for 18 months is not 0% for 30 months, and any debt payoff calculator that ignores the promo expiration will produce a misleadingly short timeline.
Adjusting the calculator for reality
Two adjustments keep the output honest. First, model the post-promotional APR as a separate scenario to see the worst case after the teaser period ends. Second, for variable-rate cards, build the schedule at the current rate, then run a second scenario at a rate 200 basis points higher. If the payoff timeline stretches by more than 10% under the stress case, the plan has real rate sensitivity, and the borrower should prioritize faster payoff to reduce that exposure.
Debt Payoff vs. Debt Consolidation
When a single lower-rate loan changes the math
Consolidation rolls multiple balances into one loan, ideally at a lower weighted APR. A borrower with a 20.6% weighted rate on $28,500 in card debt, refinanced into a 12% personal loan over five years, sees monthly payments fall and total interest drop sharply. The math is the math, and on a pure cost basis, a lower fixed rate always wins.
The hidden costs most calculators miss
But consolidation is not free. Origination fees on personal loans commonly run 1% to 5% of the balance, which is added to the loan principal and accrues interest. Balance transfer cards charge 3% to 5% of the transferred amount. A 0% promotional rate is useless if the borrower cannot pay off the balance before the promo expires. The plan also depends on the borrower not running the cleared cards back up. A consolidated cardholder who charges $4,000 back onto a zero-balance card is now paying 22% on a new balance while still servicing the consolidation loan. Consolidation works when it is paired with spending discipline, and it fails when it is treated as a reset without a behavior change.
Common Mistakes That Break a Payoff Plan
Minimum-payment drift
The most common failure mode is reverting to minimum payments during a cash-flow squeeze. A single month at the minimum on a 24% card adds back several hundred dollars in projected interest and resets part of the schedule. The fix is structural: automate the extra payment on payday, treat the payment as a non-negotiable line item, and rebuild the plan rather than abandoning it when income drops.
Ignoring utilization and credit score effects
Payoff calculators focus on interest cost, but credit scores respond to credit utilization, defined as the ratio of balances to credit limits. Paying down a card to zero lowers utilization on that card and can lift the score. Closing that card after paying it off, however, reduces total available credit and can push utilization up on the remaining cards. Borrowers who plan to apply for new credit in the next 12 months should keep the paid-off cards open with a zero balance and use them sparingly.
Building a Working Plan in Five Steps
A practical sequence for the next 30 days
- List every debt. Balance, APR, minimum payment, and the issuer’s name. Pull statements rather than relying on memory.
- Compute the weighted average APR. This number anchors every later comparison.
- Pick a strategy. Avalanche minimizes interest; snowball maximizes early wins. Choose the one you will actually run.
- Set a realistic extra payment. Five to ten percent of take-home pay is a common starting point. Run the calculator at that figure.
- Automate the plan. Schedule the extra payment on the day after the paycheck clears, and review the schedule once a month. Update the calculator whenever an APR changes or a balance is paid off.
Chart: Debt Payoff Timeline by StrategyKey Takeaway: A debt payoff calculator is a planning tool, not a binding contract. Its value comes from forcing specific numbers into a specific timeline, then committing to the cash flow that the timeline requires.
Frequently Asked Questions
How does a debt payoff calculator work?
A debt payoff calculator uses the standard loan amortization formula. For each debt, you supply the balance, the APR, and the monthly payment. The calculator iterates month by month, charging interest on the declining balance and subtracting the principal portion of each payment, until the balance reaches zero. The output is a total timeline, total interest paid, and an amortization schedule showing how each payment splits between interest and principal.
What is the debt avalanche method and how does it differ from the snowball method?
The avalanche method targets the debt with the highest APR first, paying the minimum on everything else and routing every extra dollar to the highest-rate balance. The snowball method targets the smallest balance first, even if the rate is lower. Avalanche minimizes total interest and shortens the timeline. Snowball produces earlier wins and tends to improve follow-through, often at the cost of slightly higher total interest over the life of the plan.
Which debt payoff strategy saves the most money on interest?
Mathematically, the avalanche method saves the most, because it directs cash to the highest-cost balance first. The savings vary by portfolio. On a high-rate, high-balance card stack, the gap can reach several thousand dollars. On a portfolio of similar-rate balances, the difference is small enough that behavioral factors often decide the choice.
Can extra payments really reduce the time it takes to pay off debt?
Yes. Extra payments shorten the timeline because they reduce principal directly, which in turn reduces the interest charged in every subsequent month. The effect compounds: paying an extra $200 per month on a $10,000 balance at 20% APR typically shortens the payoff by more than a year and reduces total interest by thousands of dollars. The larger the extra payment and the higher the rate, the larger the time savings.
Is a debt payoff calculator accurate for variable interest rate loans?
It is accurate at the inputs you supply. Variable-rate loans require an assumption about the future rate path, and most calculators use the current APR. To stress-test the plan, run the schedule at the current rate and again at a rate two to three percentage points higher. The difference between the two timelines is a rough measure of rate sensitivity. Promotional 0% APR offers should be modeled with two phases: the promo period at 0%, and the post-promo period at the card’s standard APR.
When should I choose debt consolidation instead of a payoff plan?
Consolidation is worth considering when a borrower can lock in a fixed rate materially below the weighted average rate on existing balances, and when the term of the new loan does not stretch payments so far that total interest increases. Origination fees, balance transfer fees, and the risk of reloading the cleared cards all affect the calculation. A consolidation that lowers the rate by less than the combined fees is usually not worth it.
Does paying off debt early hurt your credit score?
Paying off debt generally helps a credit score, especially when it reduces credit card utilization. The one exception is closing accounts after paying them off, which reduces total available credit and can push utilization up on remaining cards. Keeping paid-off cards open with a zero balance preserves the utilization benefit. Installment loans paid off early can produce a small score dip from a reduced mix of credit types, but the long-term effect is usually neutral or positive.
What is the fastest way to pay off high-interest credit card debt?
The fastest mathematically optimal path is the avalanche method with the largest extra payment the cash flow can sustain. Automation, direct deposit splits, and side-income dedicated entirely to the highest-rate balance all accelerate the timeline. Selling unused assets, redirecting windfalls, and temporarily cutting discretionary categories can also free up meaningful additional principal. The fastest path, however, is the one the borrower will execute consistently, and that often means accepting a slightly slower strategy in exchange for steady follow-through.
Conclusion
A debt payoff calculator is most useful when it forces a decision. The math behind avalanche, snowball, extra payments, and consolidation is settled. The variable is the borrower’s behavior over the next four to five years. Start by listing the balances, the APRs, and the realistic monthly budget. Run the calculator under both avalanche and snowball. Pick the plan whose timeline you can actually commit to, automate the extra payment, and revisit the schedule whenever an APR changes or a balance clears.
The next practical step is a 30-minute session: pull three months of statements, build the weighted average APR, and run one scenario at the current minimum and another at a realistic extra payment. The gap between the two numbers is the cost of waiting, and it is usually larger than most borrowers expect. Market conditions, personal income, and interest rates can all change during a payoff window, so review the plan quarterly and adjust the extra payment whenever cash flow allows. The objective is not perfection; it is progress that compounds.
Borrowers should remember that all payoff strategies carry execution risk, that interest rate environments shift in response to Federal Reserve policy and broader macroeconomic conditions, and that no calculator can predict job loss, medical expenses, or other disruptions to income. Payoff plans are projections, not guarantees, and the most successful borrowers are the ones who revisit the numbers regularly rather than setting them once and walking away.
—
This article is for educational purposes only and does not constitute investment, tax, or financial advice. Debt payoff strategies involve risk, and individual results will vary based on income stability, interest rate movements, and borrower behavior. Never commit funds to a payoff plan that you cannot afford to lose access to in an emergency.
Last reviewed: Current Month Year.